
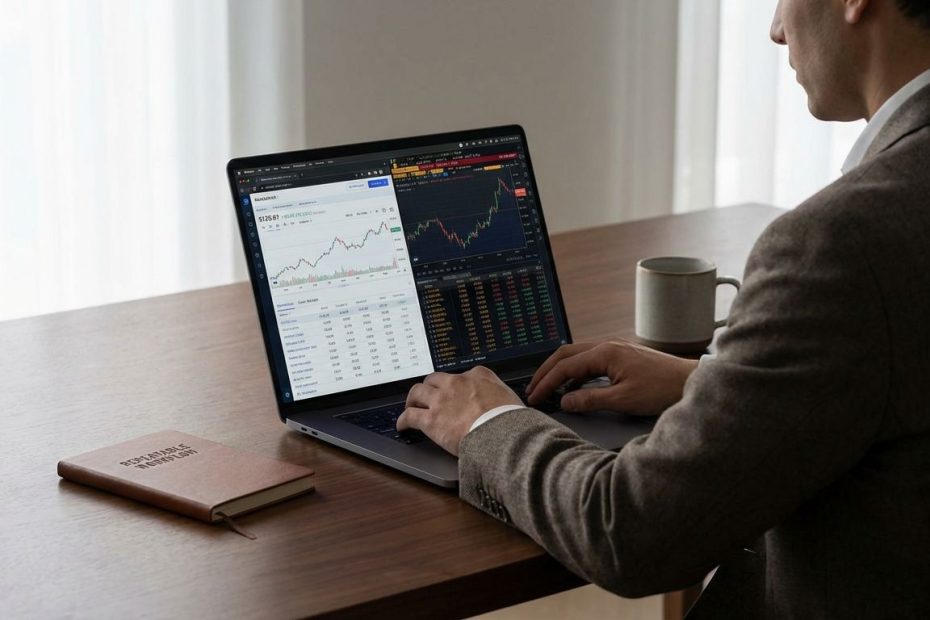
Choose stock analysis software by matching the tool to how you make decisions: screening to generate candidates, charting to time entries and exits, fundamentals to judge business quality and valuation, and portfolio analytics to control risk and position sizing.
You can save years of trial-and-error by setting a clear workflow, defining the data latency you can tolerate, then paying only for features you will use weekly. This guide shows how to pick the right platform for your strategy, how to compare real pricing and plan limits, and how to build a clean, repeatable research routine that holds up when markets get noisy.
What Is The Best Stock Analysis Software For Beginners In 2026?
The best beginner software is the one that gets you from “too many tickers” to a shortlist in minutes, then lets you validate ideas without burying you in settings. Your early priority is speed, consistency, and a simple routine you can repeat, not maximum feature depth.
A practical beginner setup is a fast screener for idea generation plus a charting tool for confirmation. You want saved screens, watchlists, basic alerts, and clean charts with a handful of indicators, since those features build the habit of checking the same signals the same way every time.
Start with a free tier, learn what inputs you actually use, then upgrade once the free limits create friction. Upgrading too early locks you into paying for features you will not touch, while upgrading too late wastes time doing manual work that software can automate.
Beginner buyers should also treat “data quality” as a feature, not a marketing line. If you cannot explain where the numbers come from, how often they refresh, and what is delayed versus real-time, you will make decisions based on stale or mismatched inputs.
TradingView Vs. Stock Rover: Which Should You Choose For Stock Analysis?
This decision comes down to what drives your decisions. If your day-to-day process starts with price action, levels, trends, and alerts, TradingView fits naturally. If your process starts with business performance, valuation ratios, financial statements, and portfolio analytics, Stock Rover usually fits better.
TradingView is built around charting depth and flexibility. You get strong multi-timeframe charting, a large indicator ecosystem, customizable alerts, and a workflow that favors active monitoring. When timing matters, chart-first tools keep you fast, especially when you need to scan many symbols quickly.
Stock Rover leans into fundamental research and investor-style workflow. It tends to be more useful when you compare companies across consistent metrics, track portfolio exposures, monitor valuation changes, and run screens based on financial quality. That matters when your holding periods are longer and you care more about “business progress” than intraday noise.
Pricing signals the positioning. Benzinga cites Stock Rover plans starting around $7.99/month and reaching about $27.99/month for higher tiers, which typically aligns with “fundamentals-first, investor-grade features” at a relatively accessible cost.
What’s The Best Free Stock Screener, And When Is It Worth Paying?
A strong free screener is one that filters quickly, loads reliably, and lets you save the exact filters you use most. Free screeners are excellent for learning: you can test what matters in your process, identify which filters actually change outcomes, and build discipline without paying before you have a routine.
It becomes worth paying when free limits force you into workarounds. Common “upgrade triggers” include needing real-time quotes, exporting results to spreadsheets, building repeatable screens with more filters, saving more presets, using backtests, or running alerts that cover many tickers.
FINVIZ is a frequent starting point because the free experience is usable and the paid tier is straightforward. FINVIZ*Elite lists a 7-day free trial with no credit card required, then $39.50/month billed monthly or $299.50/year billed annually, with Elite positioning tied to real-time data, an ad-free interface, exporting/API access, and advanced features like backtests.
When you pay, treat the subscription like a productivity tool. If a paid tier saves you several hours a month in manual filtering, tracking, and rewriting notes, the subscription often pays for itself through better consistency and fewer missed checks.
Do You Need Real-Time Market Data In Your Analysis Software?
Real-time data matters when you make decisions on short horizons. If you trade intraday moves, react to rapid price changes, or rely on precise alerts, real-time quotes reduce the risk of acting on outdated prints. If you evaluate weekly or monthly, delayed data is usually acceptable.
Buyers often misjudge this and overpay. A cleaner decision rule is to match data speed to the time you hold risk. Minutes-to-hours holding periods align with real-time needs. Multi-week holding periods usually align with end-of-day review, where delayed quotes do not break the process.
Also separate “real-time quotes” from “real-time workflow.” A tool can deliver real-time prices yet still slow you down with clunky scanning and weak alerting. You want fast filters, saved views, and alerts that match your process, not just a timestamp that looks impressive.
FINVIZ*Elite explicitly includes real-time data in its Elite plans and describes coverage that includes premarket and after-hours sessions. That kind of packaging is valuable when you actively monitor and need consistency across sessions, not only during regular hours.
What Features Matter Most When Choosing Stock Analysis Software?
The features that matter most are the ones you will actually rely on every week inside your decision workflow. Instead of comparing platforms by counting how many tools they advertise, match the software to the specific job you expect it to perform: generating ideas, validating trades, evaluating businesses, or managing risk. A platform becomes valuable when it removes friction from that routine and lets you reproduce the same decisions consistently.
Screening & Idea Generation
Screening determines how quickly you move from thousands of tickers to a manageable shortlist. The core requirement is not “more filters,” but precise filters that express your strategy clearly and can be repeated without rebuilding them each session.
Key capabilities that matter:
- Fast filtering across large universes without lag
- Saved screens and presets you can rerun instantly
- Watchlists tied directly to screen results
- Snapshot/export capability for record-keeping
- Consistent metric definitions across runs
If you cannot recreate yesterday’s screen exactly, your decision process slowly becomes subjective. Good screening software acts like a checklist — it forces discipline and prevents you from chasing random setups.
Charting & Trade Timing
Charting is where execution quality lives. The important question is not how beautiful the chart looks, but whether it supports fast and repeatable decisions under pressure.
Focus on workflow depth rather than cosmetics:
- Flexible multi-chart layouts
- Indicator limits that support your template
- Drawing tools for marking levels and zones
- Reliable alerts based on price, indicators, or structure
- Quick symbol switching without resetting layouts
Lower-tier plans often restrict indicators, layouts, or alerts. Those restrictions directly affect performance because they force compromises in your analysis process. For active monitoring, limits become operational bottlenecks rather than minor inconveniences.
Fundamental Research & Valuation Analysis
Fundamental research matters when your decisions depend on business quality rather than short-term price movement. The platform should make company comparison fast and consistent instead of turning analysis into manual spreadsheet work.
Look for tools that provide:
- Clean financial statements and standardized ratios
- Long historical data to view business cycles
- Comparable peer analysis across industries
- Estimate tracking and revision visibility
- Portfolio exposure and valuation monitoring
A strong fundamental workflow answers three questions quickly:
Is the business improving? Is the valuation reasonable? Has anything materially changed?
If the platform makes you hunt across multiple pages to answer those, it slows decision clarity.
Backtesting, Alerts & Automation
Backtesting and automation matter when you want to validate rules instead of relying on memory or intuition. These features are not necessary for every investor, but when used properly they dramatically improve consistency.
High-value capabilities include:
- Strategy testing on historical data
- Rule-based alerts triggered automatically
- Batch scanning across watchlists
- Scheduled reports or notifications
- Repeatable rule execution without manual checking
The purpose is not prediction — it is discipline. Automation prevents selective memory and helps you follow the same criteria regardless of market noise.
The Practical Rule
Choose software based on the job:
- Idea generation → Screening speed and saved filters
- Timing decisions → Charting workflow and alerts
- Investment evaluation → Fundamental comparison tools
- Process consistency → Backtesting and automation
The best platform is not the one with the most features — it is the one that removes the most friction from your repeatable weekly routine.
Is Koyfin Good For Stock Analysis, Or Is It More Of A Macro Platform?
Koyfin fits well when you want stocks inside a broader market dashboard. It is often used as a multi-asset workspace where you watch equities alongside macro indicators, rates, FX, and sector behavior, then drill down into companies when something shifts.
Koyfin’s pricing page shows a clear ladder: a Free tier at $0/month, Plus at $39/month, and Premium at $79/month. The plan descriptions emphasize longer financial history and estimates at higher tiers, plus more research depth, dashboards, screens, and portfolio analytics.
For many investors, that structure makes sense. You can start free to validate whether you like the interface and dashboards, then upgrade once you need deeper history, broader coverage, or more screens and watchlists. The upgrade path stays readable, which matters when you are trying to keep tooling costs aligned with actual use.
If your daily process is heavy fundamental comparison and portfolio-level decision-making, Koyfin can be strong as a central dashboard. If your daily process is timing-driven chart work, pairing Koyfin with a chart-first platform can keep you fast without forcing one tool to do everything.
How Should You Build A Reliable Stock Analysis Workflow Before Buying Anything?
You will make better software decisions when the workflow is defined first. Start by writing down your repeatable sequence: where ideas come from, how you screen, how you validate, how you size positions, and how you decide to exit. Without that, every tool demo looks impressive and every paid tier sounds necessary.
Set your minimum viable workflow in three steps: generate candidates, validate the setup, then track. Candidate generation needs a screener and saved filters. Validation needs either charts, fundamentals, or both, depending on your style. Tracking needs watchlists, alerts, and notes so you do not reinvent decisions each week.
Once the workflow is written, you can map tool features to each step and eliminate clutter. If your process never uses backtesting, do not pay for it. If you never export, API access is not a selling point. If alerts drive your discipline, then alert limits and reliability become a top-tier buying factor.
Run the workflow for two weeks on free tiers and document where friction appears. The friction points become your paid requirements, which keeps the upgrade decision objective and prevents feature shopping.
How Do You Compare Pricing Without Getting Trapped By Tier Marketing?
Tier marketing works because buyers compare names rather than limits. Ignore labels like “Plus” or “Premium” and focus on the constraints that affect your daily routine: number of alerts, number of indicators per chart, number of watchlists and screens, export limits, and how much historical data you can access.
Start with your weekly cadence and convert it to requirements. If you monitor 40 symbols and rely on alerts, you need enough alerts to cover the list with room for replacements. If you analyze 10 candidates per week using a consistent chart template, you need saved layouts that load fast and do not break.
Then treat pricing as a portfolio decision. A subscription is not “cheap” or “expensive” in isolation. It is justified when it reduces errors, enforces discipline, and saves time in repetitive work. If it only adds optional features you rarely touch, it becomes noise and cost.
Use published pricing for anchoring, then verify what you actually get at each tier. FINVIZ*Elite publishes a 7-day trial with no card and lists monthly and annual prices. Koyfin publishes Free, Plus, and Premium monthly rates. TradingView pricing varies by plan and billing cadence, so plan details and limits should be confirmed before committing.
What Should You Look For In A Stock Screener If You Invest Long Term?
Long-term screening succeeds when it filters for business quality, financial durability, and valuation discipline, then helps you track a watchlist over time. You need consistent fundamental fields, enough history to see cycles, and the ability to save and rerun the same screen without manual rebuilding.
Pay attention to data consistency and metric definitions. If two tools calculate the same ratio differently, comparisons across platforms create false conclusions. Stick to one primary source for key metrics, then use secondary tools for validation, charting, or monitoring.
Portfolio features matter more than most long-term investors admit. Concentration can creep up through correlated positions, sector overlap, or crowded themes. A platform that flags exposures, contribution, and drift supports better decisions than one that only looks good on single-stock pages.
If the screener supports exports, you can build a simple process around a spreadsheet or journal that captures why each name made the list. That habit reduces random switching and gives you a clean record to evaluate results later.
What Should You Look For In Charting Software If You Trade Actively?
Active charting is a speed game and a consistency game. You need layouts that match your strategy, alerts that fire reliably, and enough indicator capacity to run your template without compromises. When the tool slows you down, execution quality drops and errors rise.
Focus on alerting and workflow depth, not cosmetic chart styles. Strong charting software supports multi-timeframe views, saved templates, quick symbol switching, and alert rules that match how you manage risk. If you cannot set alerts quickly and trust them, you will over-monitor and burn time.
Plan limits matter. Many charting platforms cap the number of indicators, charts per layout, and alerts on lower tiers. Those caps shape your behavior, so choose a tier that supports your standard template plus a margin for experimentation.
Also validate data session coverage and latency. If you watch premarket or after-hours, confirm that the data feed and session settings match your trading hours. Otherwise you end up with charts that look right but do not reflect the prices you are reacting to.
How Can You Test Stock Analysis Software In One Week Without Wasting Time?
A one-week test succeeds when you run your real routine, not a tour of features. Pick one strategy and one watchlist size, then execute the same workflow daily: screen, shortlist, validate, track, and review. Keep notes on where the platform helps and where it forces workarounds.
Create a small scorecard before the trial starts. Score speed (how quickly you get to a shortlist), clarity (how easy it is to confirm an idea), reliability (loading, alerts, exports), and discipline support (notes, watchlists, reminders). That prevents the trial from turning into random clicking.
Also test “repeatability.” Save a screen, save a chart template, set alerts, then reload everything the next day. If settings do not persist cleanly, you will pay for a tool that resets your work and adds friction, which defeats the purpose of subscribing.
If a platform offers a no-card trial, run it early and aggressively. FINVIZ*Elite states a 7-day trial without a credit card requirement, which makes it straightforward to test the workflow without worrying about cancel timing.
Best Stock Analysis Software For Most Investors
- Use a screener for candidates, charting for timing, fundamentals for quality and valuation.
- Pay when you need real-time data, exports, more alerts, saved screens, or deeper history.
Put Your Tool Stack To Work This Week
Pick software that matches how you decide, then enforce a repeatable workflow that stays stable across market conditions. Start free, identify friction points, then pay only for features that remove real bottlenecks in screening, charting, fundamental validation, or portfolio control. Use published pricing as an anchor, then verify plan limits around alerts, exports, and historical depth before committing. Once the tools are selected, lock in a weekly routine that produces a shortlist, documented decisions, and measurable outcomes. The win is not owning more features, it is making faster, cleaner decisions with fewer avoidable mistakes.
References
- Reddit: “What screener do you use?” (r/ValueInvesting)
- FINVIZ*Elite Help / Pricing and Trial Details
- FINVIZ Elite FAQ
- Benzinga: Stock Rover vs TradingView
- Koyfin Pricing
- Koyfin Plans Comparison
- Trade Brains: TradingView Alternatives (2026)
- Liberated Stock Trader: Stock Rover vs Finviz
- StockBrokers.com: TradingView Review and Pricing

Yitz Stern is a New York–based entrepreneur and business consultant with 20+ years of experience in alternative funding and real estate. A former CEO of Fundry and managing director at Tiger Financial Technologies, he now advises mid- to large, non-public companies on capital strategy and scalable growth while investing in multifamily real estate